There are several different ways to zoom in on a specific time period on the time series graph.
Procedure
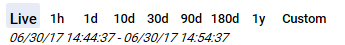
- Zoom in and out on the graph by selecting a zoom level from the options displayed at the top of the time series graph: 1 hour, 1 day, 10 days, 30 days, 90 days, 180 days, 1 year. You can also selectCustomto enter a specific date and time range.
- Or you can highlight a custom range of data on the graph as follows:
- Position the cursor on the time axis of the graph until a vertical line appears through the time.
- Drag the vertical line to the left or right to the beginning or end of the time period you want to view.
- The selected time period is highlighted and the begin and end dates are displayed next to the Custom zoom level.
- 再保险lease the mouse button and the graph is redrawn for just the time period selected.
- 重置默认选择的图Livezoom level.