Finding alert details using the Web UI
NOTE:
This chapter is not applicable to the 6100 Switch Series, which does not support the Network Analytics Engine.
You can view details on the alerts displayed in the Web UI.
Prerequisites
You must be logged in to the Web UI.
Procedure
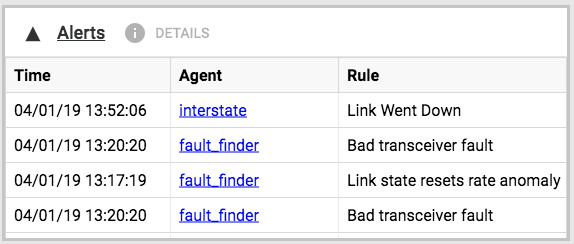
- In the Analytics Dashboard, the Alerts panel lists the alerts for all agents.
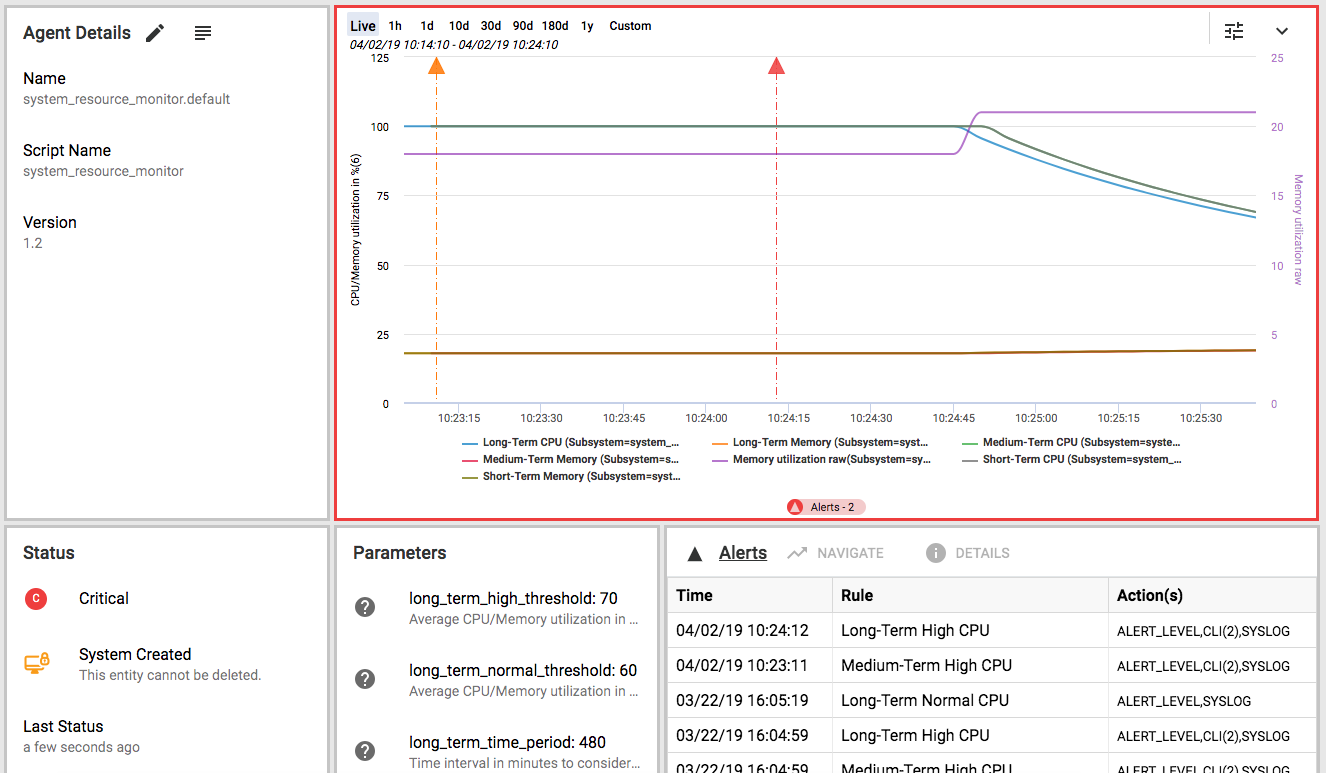
- In the Agent Details page, the agent alerts are listed in the Alerts panel.
- The行动结果(年代)in Alert Details dialog box might include additional details about actions and links to the action result output.

To view the Action Result Output dialog box for an action, click theOutputlink.


