
使用Web UI查看代理信息
您可以查看分析代理信息,包括:代理状态,脚本信息,代理参数,一个或多个时间序列图以及生成的任何警报。
先决条件
- 您必须登录到Web UI。
- 确保将运行Web UI的开关和客户端设置为使用NTP或基于UTC时间的时区。否则,NAE代理数据可能不正确或丢失。
For example, if the time on switch is set to 2 hours ahead of the client manually instead of by changing the time zone offset, the agent data is populated according to the new time on switch. If the switch time is set back to match client time later, the Time Series Database does not overwrite the old data. Therefore the client Web UI shows inaccurate data.
程序
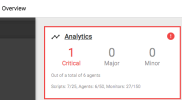
- 在概述页面中,查看Analyticspanel to see the total number of agents in critical, major, and minor status. If the panel is outlined in red, it indicates agent status issues.
图1概述页面上的分析面板
- To go to the Analytics Dashboard, select theAnalytics概述页面中的分析面板中的链接。
图2分析仪表板
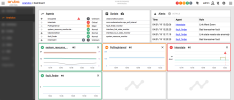
以下信息显示在分析仪表板上:
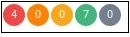
- 顶级横幅:显示每种状态类型的代理数量。
- 代理面板: Lists the agents installed on the switch and indicates the status of each agent.

If there is an error in an agent, the Agents panel shows an error icon next to the agent status.

Optionally, you can add an Analytics agent time series graph to the Analytics Dashboard by clicking the+加上代理面板中列出的任何代理商旁边的签名。
时间序列图显示了分析代理收集的数据。如果代理具有多个时间序列图,则脚本指定了分析仪表板上显示的图形。您无法选择在分析仪表板上显示的图表,但是您可以在“代理详细信息”页面中查看所有图。
点击Agents链接显示代理管理页面。在此页面上,您可以创建,编辑,删除,启用和禁用代理。
- 脚本面板:列表可用脚本。
从列表中选择一个脚本以显示脚本详细信息页面,您可以在其中查看脚本详细信息,创建一个代理以运行脚本,然后下载脚本。
点击Scripts链接显示脚本管理页面。在此页面上,您可以上传,下载或删除脚本,创建代理并访问Aruba解决方案交换以查找更多脚本。
- 警报面板:列表所有代理生成的警报。
Select an alert in the list and click细节显示警报详细信息对话框。
点击警报链接显示警报列表,其中包含有关每个警报的规则和操作的信息。
- 时间序列图:如果已将代理时间序列图添加到分析仪表板中,则该图在代理状态颜色中概述。代理可以具有一个以上的时间序列图,但是在分析仪表板中只显示了代理的一个图。单击图中的链接以显示“代理详细信息”页面。
- 顶级横幅:显示每种状态类型的代理数量。
- 从Analytics仪表板,代理面板中,选择指向特定代理的链接。显示“代理详细信息”页面。
图3代理详细信息面板示例
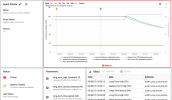
查看以下信息代理详细信息page:
- 代理详细信息面板:显示有关代理的信息。
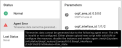
- 状态面板:显示代理的状态以及状态最后更新的状态。对于某些代理商,您可能会看到其他信息。例如:
- System Created: If the Status panel includes the statementSystem Created,无法删除代理。
- 基线阈值:If the Status panel includes Baseline Thresholds, the agent can learn about the activity being measured and set low thresholds and high thresholds based on what it learns. The Baseline Thresholds information shown in the Status panel includes the number of thresholds in the following states:
- 积极的:当基线阈值处于活动状态时,代理已经学会并建立了高和低阈值,并且代理执行操作并根据那些低或高阈值生成警报。
- 非活动:禁用代理时,基线将停止收集数据并更新阈值。在重新支持代理后,基线再次进入学习状态。
- 学习:虽然基线阈值处于学习状态:
- The agent gathers data related to that baseline until the initial learning period completes. Low and high thresholds are determined using the learning algorithm defined in the script, and are set only after learning state is completed.
- 默认阈值(如果在脚本中指定)用于确定是执行操作还是生成警报。
在启用代理后,基线阈值在脚本指定的时间内保持在学习状态。
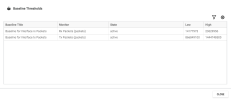
选择基线阈值显示一个对话框,该对话框显示有关代理的所有基准的其他信息,包括名称,关联的监视器,状态以及当前学到的低和高阈值。
图4基线阈值
选择
 编辑按钮来启用或禁用一个代理和莫迪fy agent parameters.
选择
 View Script button to display the Script Details page where you can view script information, create an agent to run the script, and download the script.
If there is an agent error, an error indicator is shown and you can hover over it for more information.
图5代理状态
。
- 参数面板:显示代理使用的参数。例如,参数可以是一个阈值值,当违反时,会导致代理状态更改并生成警报。选择参数将在对话框中显示描述。
- Time Series graph:绘制代理随时间收集的数据。代理可能具有一个以上的时间序列图。警报指示器和配置检查点在图表上覆盖。
警报指示器可以包括:用于警报的红色或黄色三角形,一个绿色三角形,返回正常,蓝色三角形,以指示要监视的几个资源。关于几个资源的警报的一个示例:在监视多个接口(通配符)时,如果接口降低,则会生成红色警报。如果另一个接口降低,则会生成蓝色警报。在所有接口都备份之前,不会生成绿色警报。
配置检查点在图上显示为紫色钻石。
单击图表上的警报指示器显示“警报详细信息”对话框。
- 警报面板:列表警报。
选择警报链接显示警报列表,其中包含有关每个警报的规则和操作的信息。
选择警报,然后单击细节显示警报详细信息对话框。
选择警报,然后单击导航更改时间序列图以显示此警报的时间段。


